Management Information Systems: How Data Drives Business Decisions
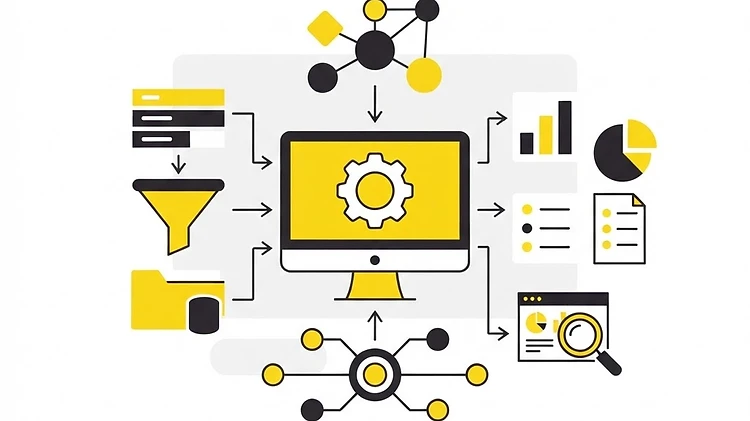
Key Takeaways
- Management Information Systems provide the infrastructure to turn raw data into actionable insights.
- Data mining and analytics allow companies to spot trends and behaviors that would otherwise be invisible.
- Mathematical tools like the inventory turnover ratio help managers quantify operational efficiency.
- Predictive modeling shifts the business strategy from reactive problem-solving to proactive planning.
Understanding Management Information Systems
In the fast-paced world of business, information is the most valuable currency. A Management Information System (MIS) is not just a piece of software; it is a structured framework that businesses use to collect, process, and store data, turning it into actionable intelligence for decision-makers. Think of it as the central nervous system of a company. Whether you are managing a small startup or a multinational corporation, an MIS allows you to monitor daily operations, track performance against objectives, and identify emerging trends before your competitors do.
From Raw Data to Strategic Insight
Data is simply the raw, unprocessed facts—like a list of individual transactions. By itself, it doesn't mean much. However, when we apply data mining, we look for patterns in large datasets. We then use data analytics to interpret those patterns, asking 'Why is this happening?' and 'What will happen next?'
Let’s look at a fictional company called 'TrendTailor,' an online boutique specializing in bespoke athletic wear. Every time a customer clicks on an item, adds it to their cart, or completes a purchase, TrendTailor records that data. By using data mining, they might discover that 70% of customers from cold-weather regions purchase neon-colored thermal socks after midnight on weekends. This is a pattern that no human manager could spot without an MIS. Armed with this insight, TrendTailor can automate their inventory procurement, ensuring those socks are always in stock in those specific regions exactly when needed.
The Math Behind the Decisions: Calculating Stock Optimization
To make effective inventory decisions, managers often calculate the 'Inventory Turnover Ratio.' This measures how efficiently a company manages its stock. The formula is:
Inventory Turnover = Cost of Goods Sold (COGS) / Average Inventory
Imagine TrendTailor has a COGS of $500,000 for their winter collection and their average inventory value is $100,000.
Inventory Turnover = $500,000 / $100,000 = 5.
This result means that TrendTailor sold and replaced their entire inventory stock five times during the season. A higher ratio generally suggests strong sales and efficient stock management. If this ratio drops suddenly, the MIS alerts managers that products are sitting stagnant, prompting a decision to run a promotional discount or remove the item from the catalog entirely. This data-driven approach removes guesswork, allowing managers to allocate capital where it is most likely to generate a return.
The Strategic Advantage of Predictive Modeling
For HL students, it is vital to understand that an MIS isn't just for looking backward; it is for looking forward. Predictive analytics uses historical data to forecast future outcomes. If TrendTailor notices a spike in demand for sustainable fabrics, their MIS can correlate this with weather patterns or social media sentiment analysis. By predicting that demand for eco-friendly joggers will increase by 20% next quarter, the firm can negotiate bulk discounts with suppliers in advance. This is the difference between being reactive—waiting for a problem to appear—and being proactive—shaping the business environment.
Key Terms
- Data Mining: The process of discovering patterns and anomalies within large datasets.
- Management Information System (MIS): A system that provides information needed to manage an organization efficiently and effectively.
- Predictive Analytics: Using statistical algorithms and machine learning to identify the likelihood of future outcomes based on historical data.
- Big Data: Extremely large datasets that may be analyzed computationally to reveal patterns, trends, and associations.
Exam Tip
Exam Tip: When writing about MIS in an exam, do not just define the system. You must analyze the impact of the information on decision-making. Always link the availability of data to a specific strategic goal, such as improving competitive advantage or cost-reduction strategies.
The Path Forward
Data is abundant, but meaningful information is rare. By mastering the tools of MIS, you transition from someone who simply observes business to someone who influences it. Technology provides the roadmap, but your ability to interpret that data is what will truly define your success. Keep digging into the numbers and testing your theories, because every data point is an opportunity to learn something new. Practice, practice, practice!
Discussion Questions
- What is the difference between raw data and information in the context of an MIS?
- How might a small e-commerce business like TrendTailor use customer behavior data to improve its marketing strategy?
- Evaluate the extent to which a reliance on data analytics can hinder a company's ability to innovate or take creative risks.